

Aggregate queries are great if you are looking just for one specific number, but if you want summarizing information like a spreadsheet-like summary you might want to consider trying a crosstab query. When you want to restructure summary data to make it easier to read and understand, consider using a Crosstab Query.
- A crosstab query is a type of Select Query. When you run a crosstab query, the results get displayed in a datasheet. This datasheet has a different structure from the other types of datasheets.
- The structure of a crosstab query can make it easier to read than a simple select query that displays the same data, as shown in the following screenshot.
By far, the simplest way to create a crosstab query in Access is to simply use the wizard that comes with Access to create your crosstab query. Let us now go to the Create tab, in the queries groups and click on query wizard.
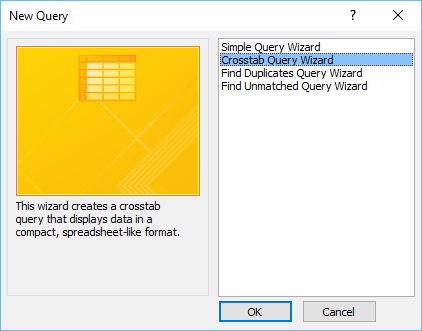
In the above dialog box, you can see all kinds of special queries. You can create a simple query wizard like how we have been doing so far from the Design View. The second one is the one we want — the crosstab query that displays data in a compact spreadsheet like format. Now, select the crosstab query and click Ok.
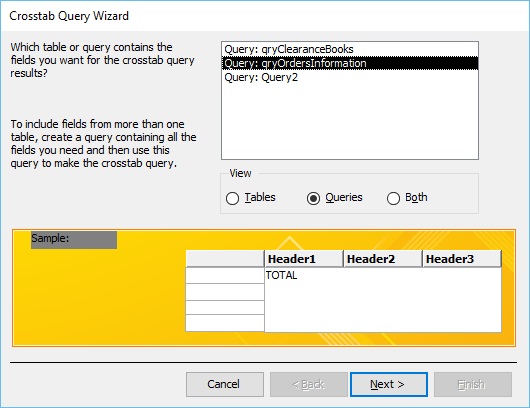
The first screen in the Wizard is going to prompt what table or query contains the fields that you want for your Crosstab Query results. Click on the Queries radio button and select qryOrdersInformation — this is the one that we created earlier which contain the subtotal, sales tax etc. Click Next.
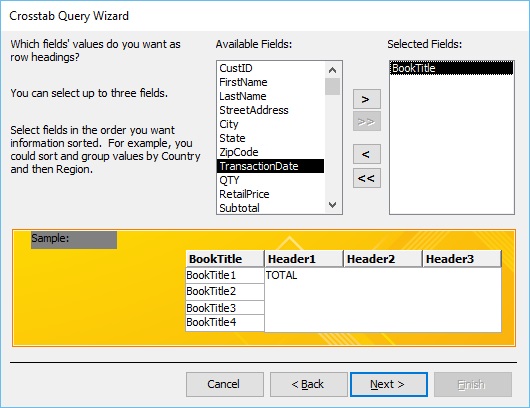
We will now look into the available fields from that query. It will prompt you to enter the field values that you want as row headings. Let us say we want a simple list of all of our different book titles. Now select the book title fields and send that over to your selected field area and click Next.
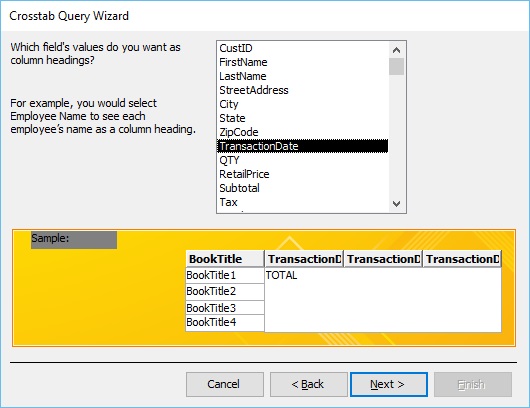
In the above dialog box, the question is what you want to use as column headings and that really depends on what you want to evaluate. Let us assume that you want to view our sales by date, choose TransactionDate and click Next.
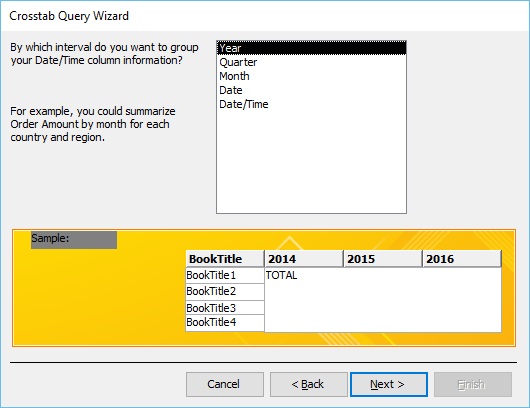
The question in the above dialog box is a specialized one based on the field we previously selected since we chose a date time column. It is asking if we want to group our date time column information by a specific interval. Select the year option and click Next.
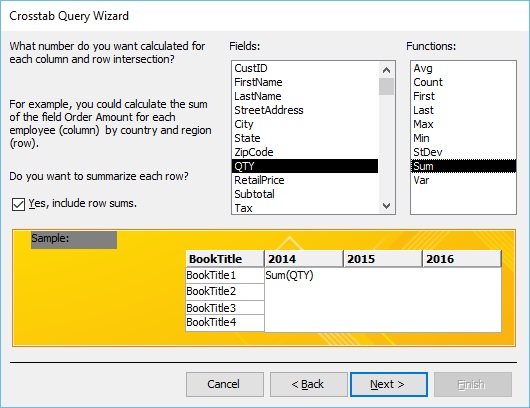
The next question in the above dialog screen asks what number do you want calculated for each column in the row intersection. In this case, we can go by quantity of the books sold by selecting quantity (QTY) and Sum from the functions and click Next.
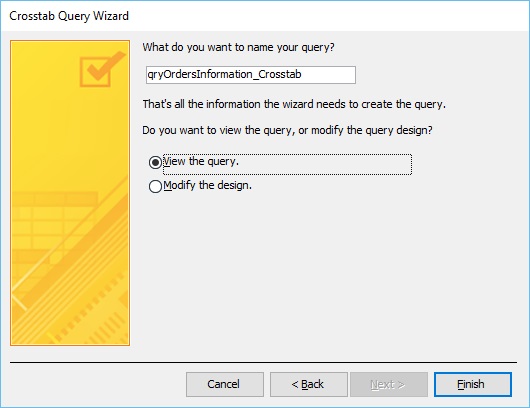
The very last screen of your wizard is going to ask what do you want to name your query and further, click Finish to View that query.
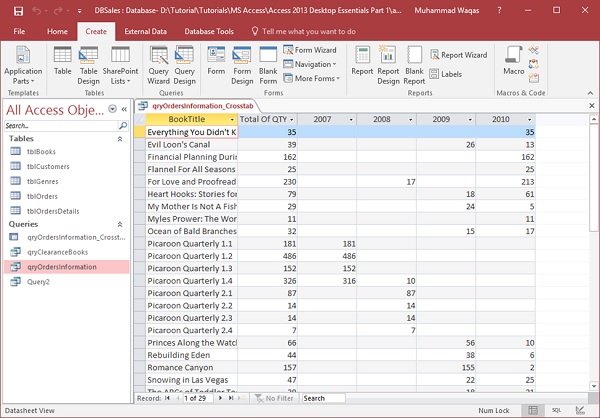
We now have book by book information and also information on the total sales like when each one of those sales occurred.