

Managing stock items in groups help in easily locating them, especially when you need to track different stock items sharing a common feature – say a common brand, product type, material used, and so on. You can get a consolidated view of the total stock items available under that group. Stock items under a group need to have the same unit of measurement for consolidation and better management. This also helps in reporting of stock items group-wise in the financial statements.
In this section
- Create Stock Groups
- Create Stock Categories
Create Stock Groups
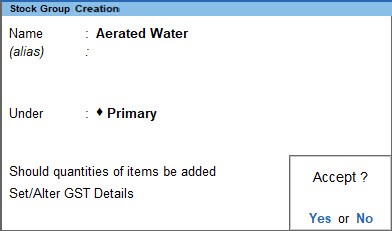
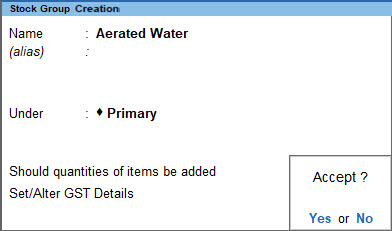
- Gateway of Tally > Create > type or select Stock Group and press Enter.
Alternatively, press Alt+G (Go To) > Create Master > type or select Stock Group > and press Enter. - Name & alias: As in other masters, you can specify multiple aliases for the stock item.
- Under: Select Primary or an existing Stock Group. If you have not created any Stock Group, you can create one in Tallyprime to assign to the stock group.
As always, press Alt+C, to create a master on the fly. Alternatively, press Alt+G (Go To) > Create Master > type or select Stock Group > press Enter. - Should quantities of items be added: It pertains to information on measuring the units of the Stock Items that you would categorise under the Stock Group. The Stock Items categorised under the group should have similar units for them to be added up. You cannot add quantities in Kgs to quantities in Pcs.
- Set/alter GST Details: Enable this option to define the GST rate.
- Accept the screen. As always, press Ctrl+A to save.
To see the F12 configurations for Stock Groups, click here.
Create Stock Categories
Stock category offers a parallel classification of stock items, categorizing items is that you can classify the stock category based on functionality together in a group. You can classify the stock category across different stock groups which enables you to obtain reports on alternatives or substitutes for a stock item.
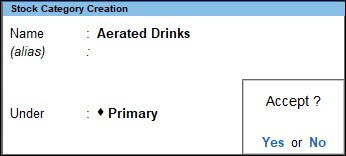
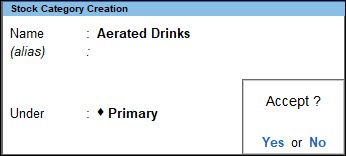
- Gateway of Tally > Create > type or select Stock Category and press Enter.
Alternatively, press Alt+G (Go To) > Create Master > type or select Stock Category > and press Enter. - Name & alias: As in other masters, you can specify multiple aliases for the stock item.
- Under: Select Primary or an existing Stock Group. If you have not created any Stock Group, you can create one in TallyPrime to assign to the stock categories.
As always, press Alt+C, to create a master on the fly. Alternatively, press Alt+G (Go To) > Create Master > type or select Stock Category > press Enter. - Accept the screen. As always, press Ctrl+A to save.
Click to see the F12 configurations for Stock Categories.
Track Stock Item Details Using Reports
Maintaining stock items will also need to know your stock positions based on different parameters – by period, by manufacturing and expiry dates, by stock groups, by age of your stock items and so on. Reports in TallyPrime provides all such details with real-time record of your stock position. You can also find out the last selling
or purchase price of the stock items as a reference to set up the price in the future. You can configure the reports to know the overall consumption and production or sort stock items or groups as you need for your business.
In this section
- Stock Summary
- Stock Group Summary
- Stock Category Summary
- Movement Analysis
- Ageing Analysis
- Stock Query
Stock Summary
The Stock Summary is a statement of the stock-in-hand on a particular date, and it updates the stock record real time. Stock Summary provides information on stock groups, and shows the quantity details, rate, and closing value of the stock items under each group. For more details, see Stock Summary.
Stock Group Summary
This report is available when the option Integrate Accounts with Inventory is set to No in the Company Features screen.
It displays Opening and Closing Stock figures from the ledger account master, rather than the inventory records. Hence, it is possible that Stock Summary and the Stock Group Summary report display different figures.
- Gateway of Tally > Profit & Loss A/c > select Opening Stock (or Closing Stock) and press Enter.
Alternatively, Alt+G (Go To) > Profit & Loss A/c > select Opening Stock (or Closing Stock) and press Enter. - Drill-down from Stock Group Summary to view the Stock Ledger account where you can manually key in the closing balance for a given date. You can enter the closing stock figures for different dates.
The date for the closing balance is the beginning from date and till date. If there is no date that follows the last, then that Closing Balance continues. A blank against a date signifies zero balance.
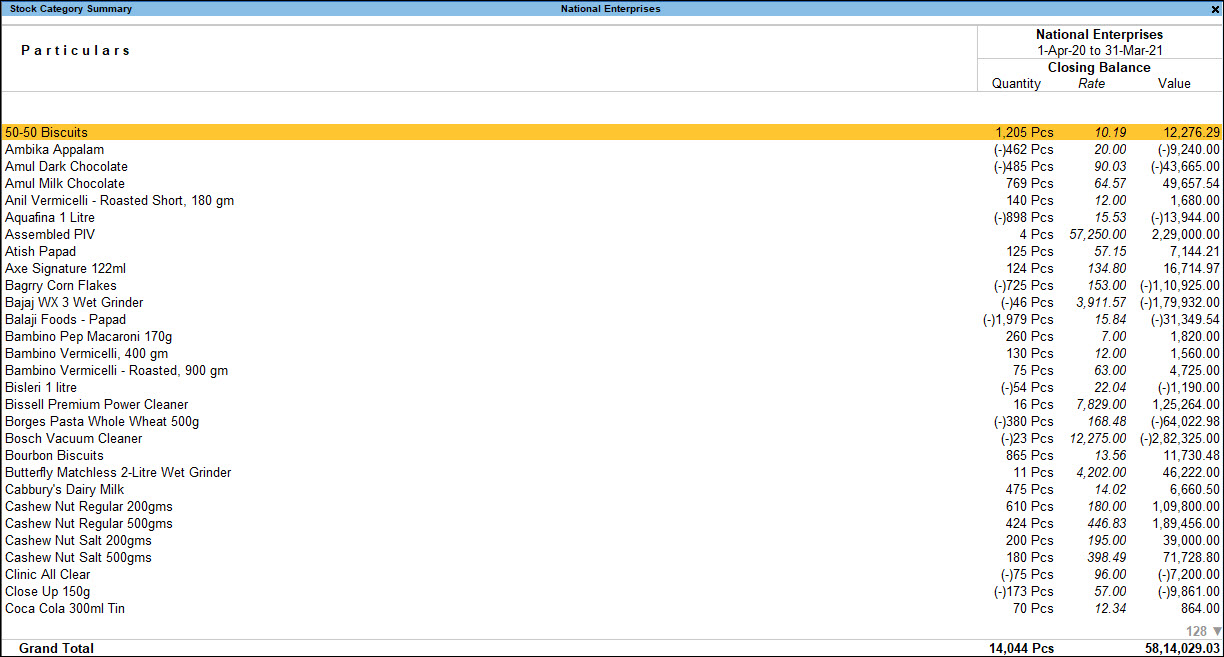
Stock Category Summary
The Stock Category Summary lists the Closing Balances of all items belonging to the selected category.
- Gateway of Tally > Display More Reports > Inventory Books > Stock Category Summary.
Alternatively, Alt+G (Go To) > type or select Stock Category Summary and press Enter. - Select a Category.
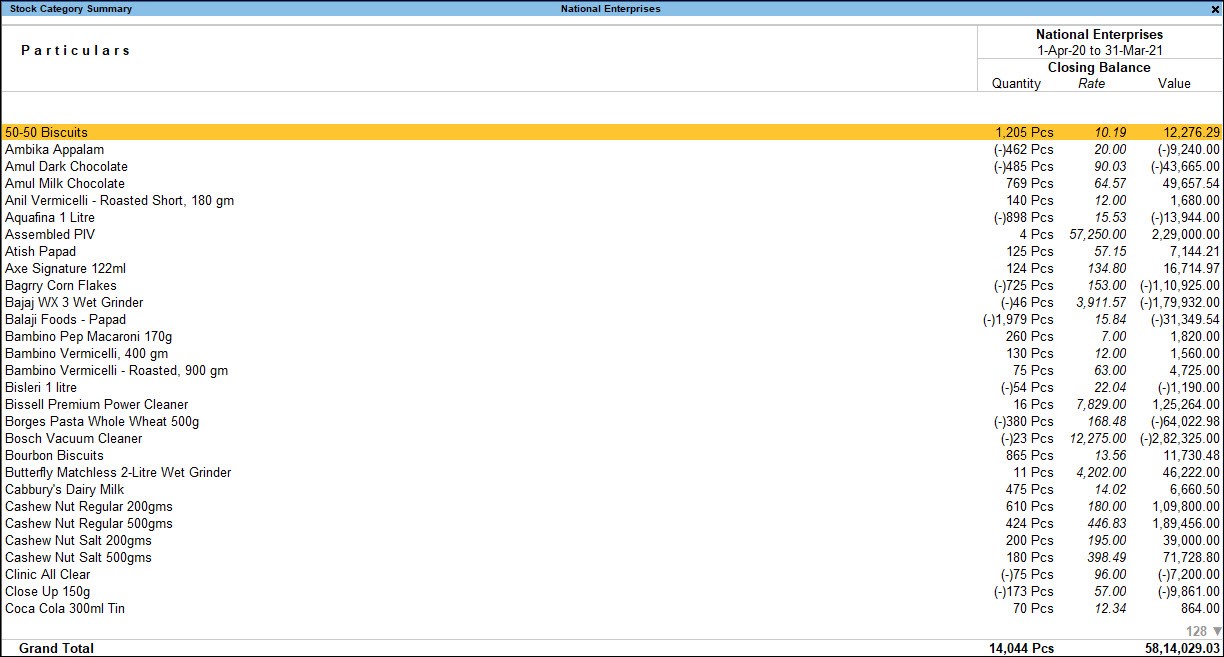
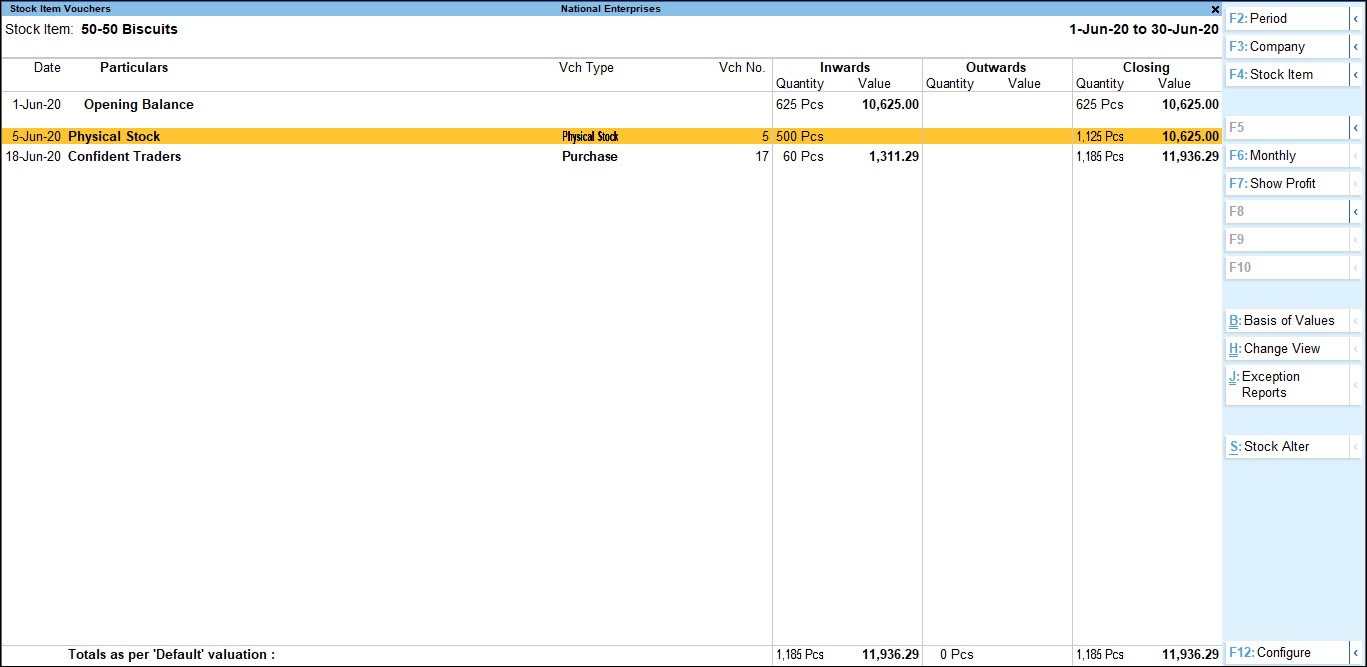
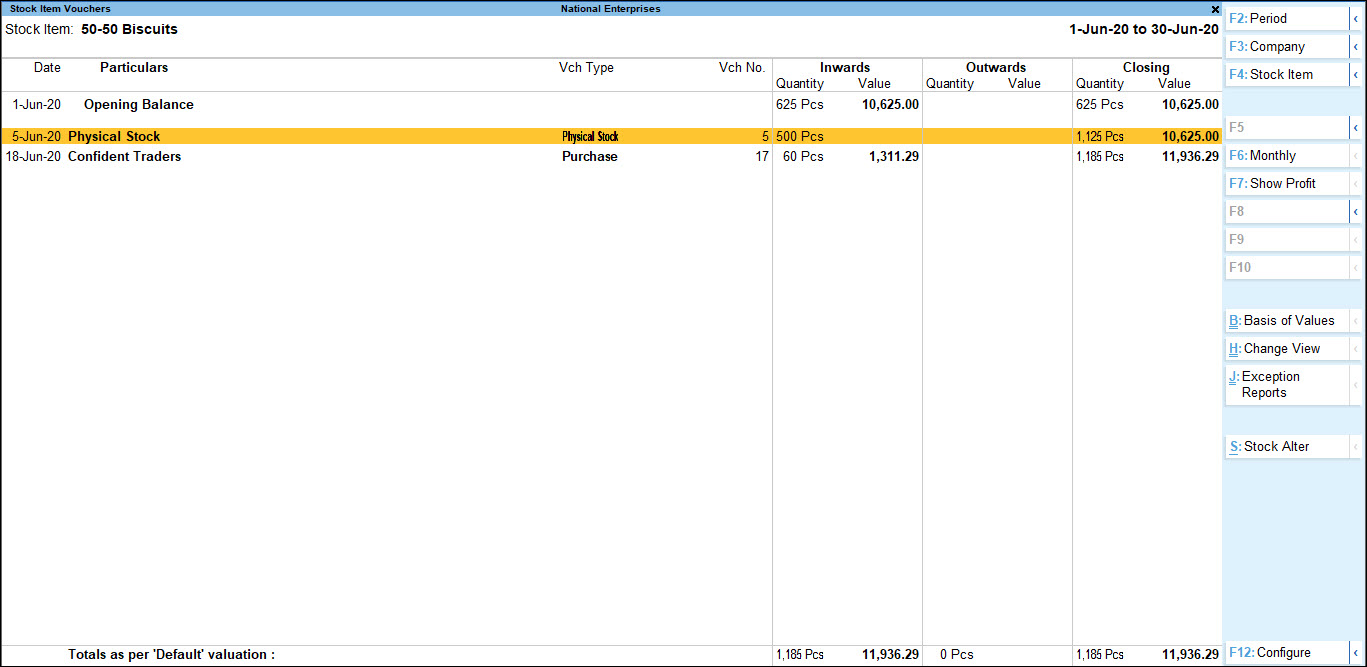
The Stock Category Summary screen appears as shown below: - You can Drill-down from stock category summary to display Stock Item Monthly Summary and Stock Voucher list.
- Use Show Profit for profitability analysis for the Items in the Category.
- Press F7 (Show Profits) to expand the Outwards Column for Consumption and Profit figures.
Movement Analysis
Movement analysis shows the analysis of only those inventory transactions which are integrated with the accounts, i.e. inventories which are also recorded in the books of accounts. Inventory vouchers which affect the stock only in quantitative terms are not considered.
Movement analysis report is used for comparative studies. They give an insight into the flow characteristics of the stock in an organization. It also helps in finding out the slow moving items which cause blockages in the flow of the working capital of the organization. For more information, refer to Movement Analysis.
Ageing Analysis
Stock Ageing Analysis Report in TallyPrime displays the age of the stock-in-hand. This report lists the age-wise break-up of inventory to demarcate old stock. TallyPrime gives its users the flexibility to define their own ageing slabs. Ageing Analysis lists out items batch wise, that have already expired or may expire in the near future. This information will help you keep track of the age of stock and also quick moving inventory, as older stock may depreciate in value or become obsolete, and result in a loss. For more information, refer to Stock Ageing Analysis Report.
Stock Query
The Stock Query report provides complete information pertaining to a particular stock item. The details include Alias, Part No., Stock Group, Stock Category, available Closing Quantity & Balance, Cost Price, Std. Selling Price, Costing Method and Market Valuation Method, and so on. For more information, refer to Stock Query Report.